
function pl(Y,A,F_r,Fs)
% Decomposed components and Hilbert spectrum presentation
% Y – Array of decomposed components (through HVD),
% A – Array of component envelopes,
% F_r – Array of component relative angular frequencies
% Fs -sampling frequency,
% F=Fs*F_r/2/pi – Plotted absolute frequecy [Hz],
%
% Example: pl(Y,A,F_r,1)
%
% © 2011 Michael Feldman
% For use with the book “HILBERT TRANSFORM APPLICATION
% IN MECHANICAL VIBRATION”, John Wiley & Sons, 2011
%
close all;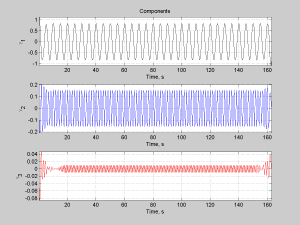
N=0; % Number of the excluded points from the start/end
s=size(Y);
pp=N+1:length(Y)-N;
t=pp/Fs; % Time
dec=round(s(1)/150);
c=[‘k- ‘; ‘b- ‘; ‘r- ‘; ‘m ‘; ‘g- ‘; ‘c- ‘; ‘y- ‘ ];
if s(2)>7 s(2)=7; end
F=F_r*Fs/2/pi; % Frequency, [Hz]
for k=1:s(2),
figure(1);
subplot(s(2),1,k,’align’);
plot(t,Y(pp,k),c(k,:));grid on;drawnow;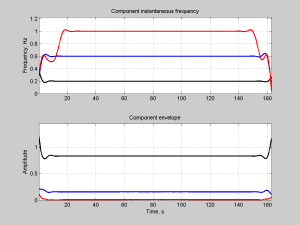
ylabel([‘^Y’ int2str(k)]);
axis([min(t) max(t) min(Y(pp,k)) max(Y(pp,k))]);
xlabel(‘Time, s’);
figure(2);
subplot(211);
plot(t,F(pp,k),c(k,:),’Linewidth’,2);drawnow;hold on;
grid on;
axis([min(t) max(t) 0 1.2*max(max(F(pp,:)))]);
ylabel(‘Frequency, Hz’);
subplot(212);
plot(t,A(pp,k),c(k,:),’Linewidth’,2);drawnow;hold on;
grid on;
axis([min(t) max(t) 0 1.2*max(max(A(pp,:))) ]);
ylabel(‘Amplitude’)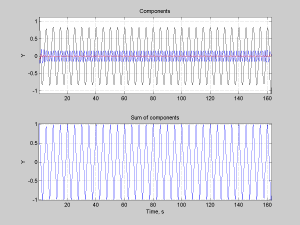
xlabel(‘Time, s’);
figure(3);
subplot(211)
plot(t,Y(pp,k),c(k,:));drawnow;hold on;
grid on;
axis([min(t) max(t) min(min(Y(pp,:))) max(max(Y(pp,:)))]);
ylabel(‘Y’);
end
figure(1); subplot(s(2),1,1,’align’); title(‘Components’);
figure(2); subplot(211); title(‘Component instantaneous frequency’);
subplot(212); title(‘Component envelope’);
figure(3); subplot(211); title(‘Components’);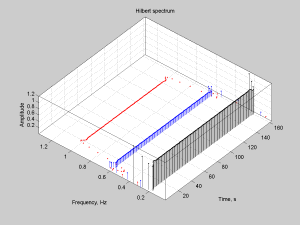
subplot(212); plot(t,sum(Y(pp,:)’)); drawnow; grid on;
axis([min(t) max(t) min(sum(Y(pp,:)’)) max(sum(Y(pp,:)’))]);
xlabel(‘Time, s’); ylabel(‘Y’); title(‘Sum of components’)
figure(4);
for k=1:s(2),
stem3(t(1:dec:length(pp)),F(pp(1:dec:length(pp)),k),(A(pp(1:dec:length(pp)),k)),c(k),’.’); hold on;drawnow;
end
xlabel(‘Time, s’);ylabel(‘Frequency, Hz’);zlabel(‘Amplitude’)
axis([min(t) max(t) 0.7*min(min(F(pp,:))) 1.3*max(max(F(pp,:))) min(min(A(pp,:))) max(max(A(pp,:)))]);
title(‘Hilbert spectrum’)
view(-50,70);
%tilefigs([2 2],20)
return
% Example
om=0.2+0.12*cos(0.4*(0:1023));
x=cos(cumtrapz(om));
[Y,A,F_r,dev]=hvd(x,3,0.05);
pl(Y,A,F_r,2*pi)