
close all; clear
N=220;
Fs=10; % Sampling frequency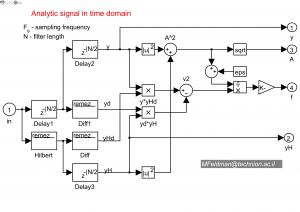
t=((0:1e3-1)/Fs)’;
u=sin(2*pi*0.5*t);
sim(‘s13’, max(t)); % Simulate a Simulink model
y=yout(:,1); % The initial signal
f=yout(:,4); % The Envelope
A=yout(:,3); % The instantaneos frequency
yH=yout(:,2); % The Hilbert transformed projection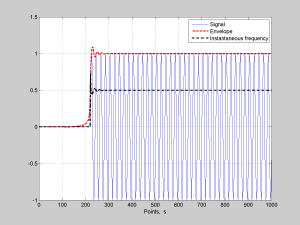
figure(1)
plot(y);hold on
plot(A,’–r’,’LineWidth’,2);hold on
plot([zeros(220,1); f(221:length(f),1)],’k-.’,’LineWidth’,2)
grid on
xlabel(‘Points, s’);
legend(‘Signal’, ‘Envelope’, ‘Instantaneous frequency’);