Hilbert Vibration Decomposition
function [Y,A,om_r,dev]=hvd(x,n,fp);
%
% x – initial signal, n – number of decomposed components
% Y – decomposed components, A – component envelopes ,
% F_r – component relative angular frequency
% F=Fs*om_r/2/pi – Absolute frequecy [Hz], Fs -sampling frequency,
% dev=std(Y_i)/std(Y_1)) – relative standard deviation of the decomposed component
%
% Example: [Y,A,om_r,dev]=hvd(x,2,0.02);
%
% LIMITATIONS:
% The sampling frequency Fs has to be in the range Fs=(20-80)*f0.
% The minimum of points in time domain is 230*3+1 = 691
%
% © 2011 Michael Feldman
% For use with the book “HILBERT TRANSFORM APPLICATION
% IN MECHANICAL VIBRATION”, John Wiley & Sons, 2011
%
if n>7; disp(‘Max number of components not greater than 7’); end
if n<=0; disp(‘Number of components less than 1’);Y=[];A=[];F_r=[];dev=[];return;end
x=x(:); s(1)=std(x);
if s(1)==0,Y=[];A=[];F_r=[];dev=[];disp(‘Zero signal’);return,end;
for k=1:n;
[At,Ft,phit]=inst(x,1);
omf=2*pi*lpf(Ft,fp);% Angular Frequency lowpass filtering (Smoothing)
[yi,Ai,phi]=synchdem(x,omf,fp);
Y(:,k)=yi; A(:,k)=Ai;
om_r(:,k)=omf; % Angular Frequency, [Radians]
x=x-yi;
s(k)=std(x)/s(1);
if k == 7, dev=[1 diff(s)]; return, end
end
dev=s; % Relative standard deviation of the components
return
%Example
om=0.2+0.12*cos(0.4*(0:1023));
x=cos(cumtrapz(om));
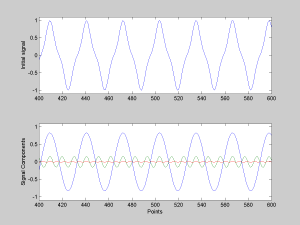
[Y,A,F_r,dev]=hvd(x,3,0.05);
figure(1);
subplot(211)
plot([x’])
axis([400 600 -1.1 1.1])
ylabel(‘Initial signal’)
subplot(212)
plot(Y)
axis([400 600 -1.1 1.1])
xlabel(‘Points’)
ylabel(‘Signal Components’)
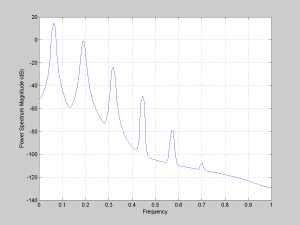
figure(2)
psd(x)
%
