
function [A,F,phi]=inst(x,Fs)
% Instantaneous characteristics of the signal x.
% Fs – Sampling frequency [Hz]
% A – Envelope
% F – Instantaneous frequency [Hz]
% phi – Instanatneous phase
% The initial signal can be presented through
% instantaneous characterisitics as x=A.*cos(phi);
%
% © 2011 Michael Feldman
% For use with the book “HILBERT TRANSFORM APPLICATION
% IN MECHANICAL VIBRATION”, John Wiley & Sons, 2011
%
% IF via symbolic difference between two arctangents
x=x(:);
xH=hilbfir(x); % Hilbert transform via FIR filter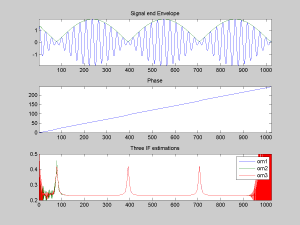
A2=(xH.^2+x.^2); A=sqrt(A2); % Envelope
Xc=x+i*xH; % Analytic signal
Xd = Xc(2:length(x)).*conj(Xc(1:length(x)-1));
omega1=angle(Xd);
om1=0.5*([0; omega1]+[omega1; 0]);
F=Fs*om1/2/pi; % Instantaneous frequency
ph1=atan2(xH,x);
phi=unwrap(ph1); % Instantaneous phase
return
Fs=1;
x=cos(0.24*(1:1024))’ + 0.9*sin(0.22*(1:1024))’ ;
[A,F1,phi]=inst(x,Fs);
om1=2*pi*F1;
% IF via analytical differentiation of the arctangent of the fraction
xd=diffir(x,Fs);
xdH=hilbfir(xd);
var2=(x.*xdH-xd.*xH);
xH=hilbfir(x);
A2=(xH.^2+x.^2);
om2=var2./A2;
% IF via differentiation of the phase angle
om3=diffir(phi,Fs);
figure(1)
subplot(311)
plot([x A]);
title(‘Signal end Envelope’)
axis tight
subplot(312)
plot([phi]);
title(‘Phase’)
axis tight
subplot(313)
plot([om1 om2 om3])
axis([0 1024 0.2 0.5])
legend(‘om1’, ‘om2’, ‘om3’)
title(‘Three IF estimations’)